How Speed Benchmark Tools Lie

Speed benchmark tools (such as Pingdom, GTMetrix, Page Speed Insights) that measure your page’s load times, can be misleading. Unfortunately, they rely on narrow definitions of best practices and don’t incorporate how a modern video player behaves, especially Vidalytics.
Vidalytics’ player is built for performance, not for benchmark tools. And it would be impossible to have perfect speed scores and a fast video player that converts in the real world.
We’ve invested more into the speed of the videos on our platform than any other area of development.
For instance, we use AI, adaptive bitrate streaming, per title encoding, multiple CDNs and a lean HTML5 player to make our player as fast as possible.
On top of this, we’ve done extensive testing to find what works best from a conversion / marketing perspective, and these are the settings that we deploy across our platform.
The downside is that some of the tools indicate Vidalytics is slow, or give us a bad speed grade. But you need not worry about these when it comes to your page speed or conversions.
Here are the things to keep in mind about Vidalytics and speed benchmark tools…
1 — Number Of Requests
One of the biggest metrics these tools look at are the number of requests your page makes for it to load.
Normally this makes sense — fewer requests typically means a faster page.
But not with how Vidalytics’ player works.
See, Vidalytics will use our Adaptive Bitrate Steaming algorithms to detect the speed of your end users’ internet connection.
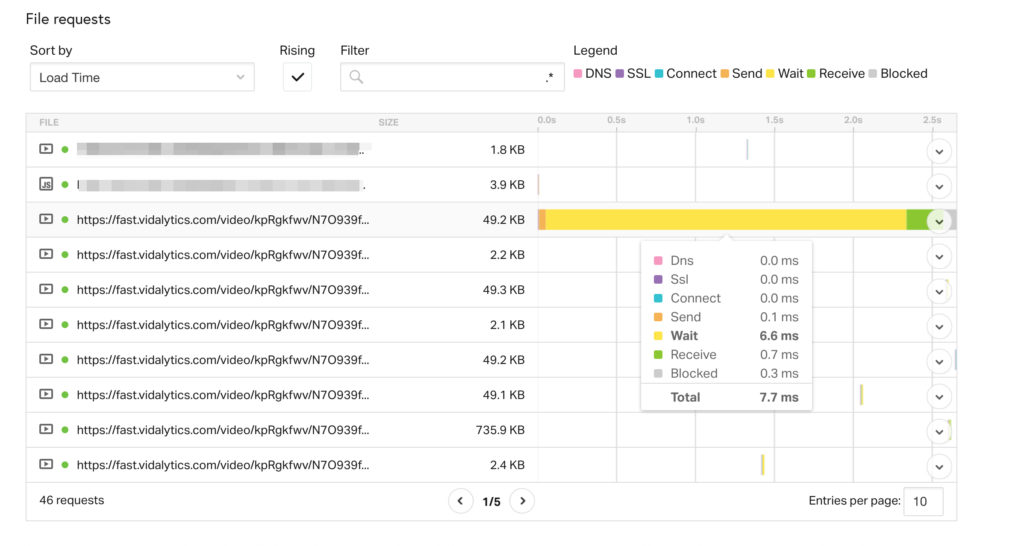
Once this establishes the speed of their connection, Vidalytics will load several segments of your video to the user.
Each few seconds are its own request, as they are divided into segments, and this allows Adaptive Bitrate Steaming to work (read more about adaptive bitrate steaming here).
This mistakenly fools the benchmark tools into thinking that these extra requests are slowing down your page.
But this is not the case, because 1) they are actually happening in the background and 2) they lead to a better user experience with the video loading faster and not buffering.
We found that when we load more of the video for the user, the video plays back faster, with less buffering and ultimately leads to higher conversions.
This situation is especially true if you’re using our Smart Autoplay feature.
Which we’ve found this leads to higher conversions. And we do this while still using less bandwidth than competing players.
2 — The Size of The Page
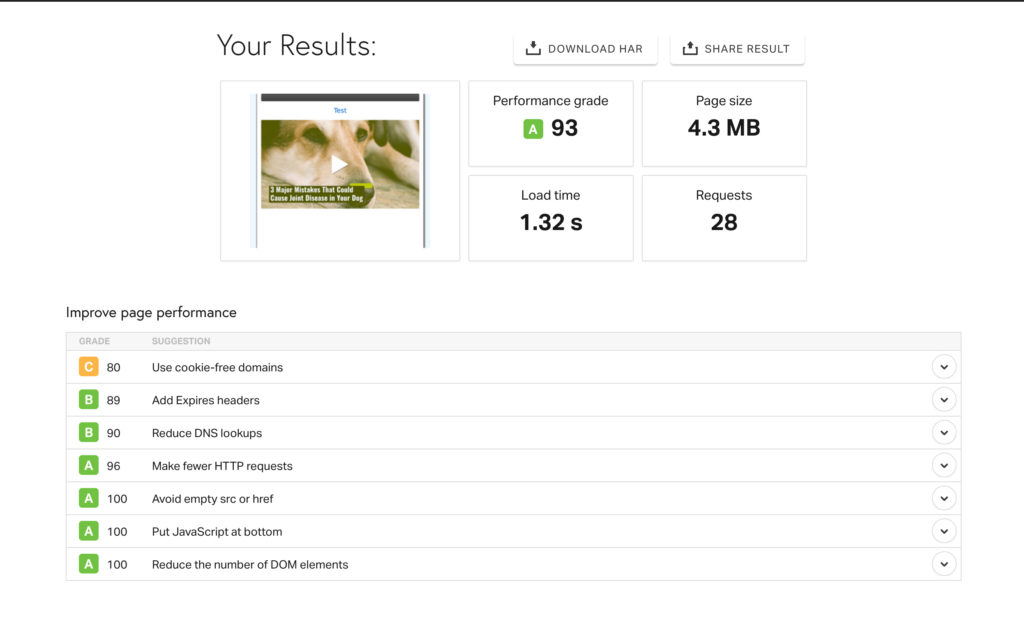
Due to the fact that we load more of your video for users, especially when features like Smart Autoplay are enabled, this increases the size of the page according to the speed benchmark tools, like Pingdom.
But we’re not actually increasing anything. We’re just loading more of your video sooner and faster, so these tools count it against your total page size.
If someone watches your video, this is going to happen either way. So it is a total miscalculation to count it some of the time and not the others.
Unfortunately, page speed tools aren’t smart enough to detect the difference.
You can easily spot this by looking at the size of the page, here:

3 — The time that really matters
Your page will typically be fully visible and can be interacted with sooner than most speed test tools will report.
Typically, the time they report is actually the time it takes for all assets on the page to load — even if they are happening in the background and the user can begin to interact with the site. This is especially true with GTMetrix.
If you see this, you want to look for when the page can begin to be interacted with. Because this is when the user would think the page is fully loaded. They won’t even know things are still happening in the background.

This is a terrible way to measure the speed of your site, because the end user can’t tell if assets are still loading behind the scenes.
Rather, they can only tell (and only care about) when the page is visible and they can begin to interact with it.
And this is what you should go by…
4 — When Does Vidalytics Video Start Playing?
If you want to know how fast your video is playing on your page, then you need to identify when the first video chunks are loaded.
Your video will start playing when this first chunk of the video is loaded. These are typically .mp4 / .m4a files you can see in the page load waterfall.
If you want a true apples to apples comparison of when two video players are actually loading, you’ll want to account for the different times it takes for the server to respond to load the page or if there are any significant differences in the speed of any assets that load before the video players.
5 — Caveats To Keep In Mind
Benchmark tools are imprecise, each time you request a page it is a dynamic occurrence to bring that page from the server where it lives to the end user’s browser. This can affect the speed of your page without you realizing it.
Keep in mind in the following…
1 — All the previous requests that happen on your page will affect when Vidalytics starts playing.
For instance, external JS can block our player, and slow Vidalytics down, by as much as a few seconds, so always be mindful of the code/scripts you have added to your page — especially any that come before the Vidalytics’ player.
If the requests that come before Vidalytics are slow, this will slow down Vidalytics at no fault of its own.
2 — Run 3 tests all back to back…
Benchmarks tools tests are best used when run at least three times, and when response times are averaged. Otherwise, you might be playing a sort of lottery where every single time you can get a different result.
3 — Use the same location every time…

Make sure they are all being requested from the same location (Pingdom in particular changes the location of where the test is being pulled from on each test, unless you manually set it).
Feel free to get in touch if you have any further questions on these topics.


